Chart 6. Literacy rate of Buraku people in reading by region
| Region | Number of Buraku people surveyed | Not at all(%) | Read only Hiragana(%) | Read a few Kanji(%) | Read commonly(%) | Unknown(%) |
|---|---|---|---|---|---|---|
| Total | 123,929 | 1.6 | 2.8 | 6.6 | 88.8 | 0.3 |
| Kanto Re. | 10,788 | 1.0 | 2.2 | 5.8 | 91.0 | 0.1 |
| Chubu | 10,715 | 0.8 | 1.5 | 4.9 | 91.4 | 1.4 |
| Kinki | 53,029 | 1.7 | 2.8 | 6.7 | 88.6 | 0.2 |
| Chugoku | 16,152 | 1.0 | 2.3 | 6.0 | 90.6 | 0.1 |
| Shikoku | 14,261 | 1.4 | 3.5 | 6.9 | 87.9 | 0.2 |
| Kyusyu | 18,981 | 2.5 | 3.7 | 7.8 | 85.8 | 0.1 |
Chart 7. Literacy rate of Buraku people in writing by region
| Number of Buraku people surveyed | Not at all(%) | Write only Hiragana(%) | Write a few Kanji(%) | Write commonly(%) | Unknown(%) | |
|---|---|---|---|---|---|---|
| Total | 123,929 | 2.2 | 3.4 | 8.0 | 86.1 | 0.3 |
| Kanto Re. | 10,788 | 1.4 | 2.4 | 7.0 | 89.0 | 0.1 |
| Chubu | 10,715 | 1.1 | 1.9 | 5.9 | 89.7 | 1.4 |
| Kinki | 53,029 | 2.5 | 3.6 | 8.4 | 85.3 | 0.2 |
| Chugoku | 16,152 | 1.4 | 2.6 | 7.3 | 88.4 | 0.2 |
| Shikoku | 14,261 | 1.8 | 4.0 | 7.9 | 85.8 | 0.5 |
| Kyusyu | 18,981 | 3.2 | 4.4 | 9.1 | 83.0 | 0.2 |
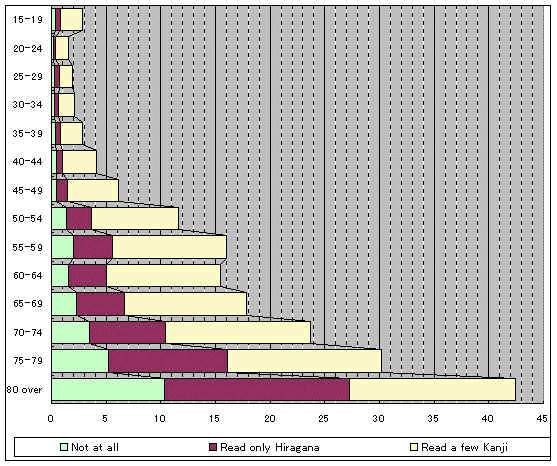
Chart 8. Illiteracy in reading by age

| age | Not at all | Read only Hiragana | Read a few Kanji |
|---|---|---|---|
| 80 over | 10.3 | 17.0 | 15.1 |
| 75-79 | 5.2 | 10.9 | 14.1 |
| 70-74 | 3.5 | 6.9 | 13.3 |
| 65-69 | 2.3 | 4.4 | 11.1 |
| 60-64 | 1.6 | 3.4 | 10.5 |
| 55-59 | 2.0 | 3.6 | 10.4 |
| 50-54 | 1.4 | 2.3 | 7.9 |
| 45-49 | 0.5 | 1.0 | 4.6 |
| 40-44 | 0.5 | 0.5 | 3.1 |
| 35-39 | 0.4 | 0.4 | 2.0 |
| 30-34 | 0.3 | 0.3 | 1.5 |
| 25-29 | 0.3 | 0.4 | 1.2 |
| 20-24 | 0.2 | 0.2 | 1.2 |
| 15-19 | 0.4 | 0.4 | 2.0 |
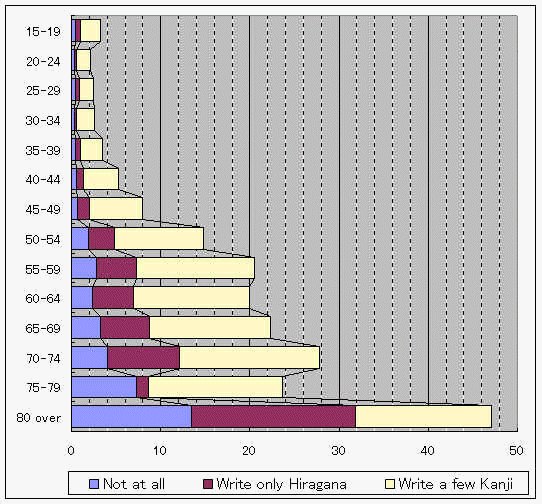
Chart 9. Illiteracy in writing by age

| age | Not at all | Write only Hiragana | Write a few Kanji |
|---|---|---|---|
| 80 over | 13.5 | 18.3 | 15.3 |
| 75-79 | 7.3 | 1.3 | 15.1 |
| 70-74 | 4.0 | 8.1 | 15.7 |
| 65-69 | 3.3 | 5.4 | 13.6 |
| 60-64 | 2.4 | 4.5 | 13.1 |
| 55-59 | 2.8 | 4.5 | 13.2 |
| 50-54 | 1.9 | 2.9 | 10.0 |
| 45-49 | 0.7 | 1.3 | 6.0 |
| 40-44 | 0.6 | 0.7 | 4.0 |
| 35-39 | 0.5 | 0.5 | 2.5 |
| 30-34 | 0.3 | 0.3 | 2.0 |
| 25-29 | 0.4 | 0.5 | 1.6 |
| 20-24 | 0.3 | 0.3 | 1.5 |
| 15-19 | 0.4 | 0.6 | 2.3 |
| BACK |
