
Grasping the Reality of Today's Buraku
Towards a Post-Special-Measures Solution to the Buraku Problem
-Part 3-
| In March 2001, around the time when the Law on Specific Budgetary Measures concerning Projects designated for Area Improvement became invalid, the local government of Osaka Prefecture released a report entitled, "Study of Actual Conditions of Dowa districts towards a Solution of Dowa Problem." The study was conducted for the purpose of collecting the most up-to-date and precise data and information concerning the Buraku problem and analyzing the collected data in the hope that it will provide the local government and other concerned bodies with a basis for developing strategies in combating Buraku discrimination in the post-Special-Measures era. Here we will focus on a report that examines living conditions in Dowa districts. The report is one of several reports(1) that were produced on the basis of the study's findings. It is a broad-based report, so we will pick up some of more interesting chapters in this series(2) in the hope that they will be relevant to the interest of our readers. Part 3 of this series focuses on the actual conditions surrounding education, specifically formal education, in Osaka Buraku communities. |
III. Education
1. Population Composition by Formal Educational Background
(1) Dowa Districts
Regarding the population composition of Dowa districts by formal educational background, the percentage of those surveyed in the 2000 study who have never gone to school or who left school at primary level dropped by 1.6 points from the 1990 study, while the percentage of those who completed higher education rose by 3.0 points.
Percentages by sex for "no school education" mark 6.4% for females and 3.1% for males, while "completed college" marks 2.0% and 6.3% respectively. (See Table 3-1)
(2) Osaka Prefecture Population Comparison
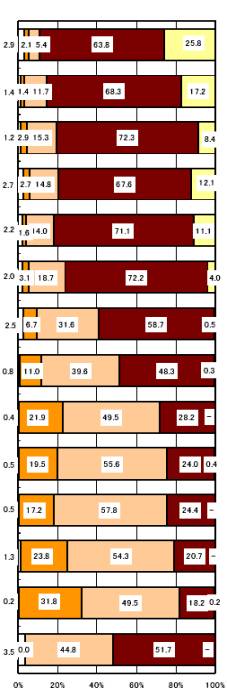
The Figure 3-1 represents population composition by educational background for Osaka Prefecture and Osaka Dowa districts. It grouped according to age in five-year brackets. As the Osaka Prefecture data is sourced from the 1990 national census, adjustments have been made in order to allow comparison with the results for Dowa districts. The "50-54" age group and those above it for Dowa districts show a different construction pattern to that for younger Dowa district age groups. One of the major characteristic differences for the younger groups can be seen in the dissolution of "non-attendance of school", which has been a long-standing problem for Dowa districts. Furthermore, the consequences of non-attendance of school in the past are apparent in the form of illiteracy among the older groups.
Another major identifiable characteristic can be seen in the rapid increase in the rate of those who go on to secondary and higher education. It was 1965 when those who are now 50 years old were in the third grade of junior high school, and 1961 when those who are now 54 years old were the same grade. The "Naniwa Scholarship Foundation (for high school students)" was formally established in 1956 in Osaka City, and the Osaka Prefectural Government reorganized high school scholarship systems as part of Dowa measures that were being implemented in Osaka Prefecture municipalities in FY1966.
These facts suggest that the scholarship system has contributed to a great change in population construction by educational background.
There are significant gaps present in every age group when comparing formal educational backgrounds among Osaka Prefecture residents. The population composition by formal educational background does not just represent the past conditions of educational progression among Dowa residents, but it is also an indication of the impact that such educational backgrounds have on work conditions among productive generations. Also, school experiences of Dowa district parents are, in many ways, reflected in the stratification of their children.
Table 3-1 Education Level Responses
| No. of responses | No school education | Completed primary education | Completed secondary education | Completed higher education | Unknown | ||||
| Junior college/specialized high school college | College | (Subtotal) | |||||||
| Sex | Male | 3,467 | 106 | 1,712 | 1,170 | 207 | 217 | 424 | 55 |
| 100.0% | 3.1% | 49.4% | 33.7% | 6.0% | 6.3% | 12.2% | 1.6% | ||
| Female | 3,917 | 249 | 1,947 | 1,213 | 372 | 79 | 451 | 57 | |
| 100.0% | 6.4% | 49.7% | 31.0% | 9.5% | 2.0% | 11.5% | 1.5% | ||
| 2000 study | 7,384 | 355 | 3,659 | 2,383 | 579 | 296 | 875 | 112 | |
| 100.0% | 4.8% | 49.6% | 32.3% | 7.8% | 4.0% | 11.8% | 1.5% | ||
| 1990 study | 64,500 | 4,096 | 34,583 | 19,713 | 3,205 | 2,479 | 5,684 | 424 | |
| 100.0% | 6.4% | 53.6% | 30.6% | 5.0% | 3.8% | 8.8% | 0.7% | ||
Notes:
- The number of responses excludes those who are still in school. 1. The number of responses excludes those who are still in school.
- "No school education" includes both those who have never gone to school and those who left school at primary level.
"Completed primary education" includes those who completed primary school, dropped out of junior high school, completed junior high school, or dropped out of high school.
"Completed secondary education" includes those who graduated from high school and those who dropped out of junior college or specialized high school.
"Completed higher education" includes those who graduated from junior college or specialized high schools and those who graduated from colleges (four years) as specified below:
Those who completed junior college/specialized high school includes those who completed junior college/specialized high school and those who dropped out of college.
Those who completed college are those who graduated from college.
Figure3-1: Population composition by educational background
| Dowa Districts: 2000 study | (Age) | Osaka Prefecture: 1990 study |
 |
over80 | 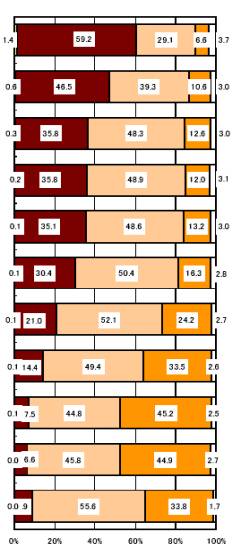 |
| 75-79 | ||
| 70-74 | ||
| 65-69 | ||
| 60-64 | ||
| 55-59 | ||
| 50-54 | ||
| 45-49 | ||
| 40-44 | ||
| 35-39 | ||
| 30-34 | ||
| 25-29 | ||
| 20-24 | ||
| 15-19 |
Notes:
- The figures of Osaka Prefecture represent estimated figures, which were modified on the basis of the 1990 National Census.
- The classification of educational background in this figure follows that of the National Census.
- The age group of 15-19 and 20-24 include people who are at school.
2. Scholarship Programs
1) In the case of normal and specialized high schools
i) Use of scholarships and other programs:
Among parents of high school students, 67.8% use financial programs to support educational expenses for their children. Of these, 56.4% use the "scholarship under the Dowa measures," while the other 11.2% use other financial programs including the "insurance scheme for educational expenses" offered by post offices and banks (8.5%) and the "bank loan for educational expenses" (2.7%). Those parents who do not use any financial program account for 31.0%.
Regarding final educational backgrounds of those parents who use the Dowa measures scholarship program, those who achieved "primary school or junior high school graduation" hold the highest proportion at 69.1%, while those who are "college graduates" hold the lowest at 30.0%. Those who use other sources of financial support, including the Japan Scholarship Foundation, Osaka Prefectural Scholarship Foundation and bank loans, are evenly distributed in all groups at around 15-20%.
Referencing the data by annual family income, it is apparent that all income groups use the "scholarship program under the Dowa measures" to a similar extent. The use of other financial programs including the Japan Scholarship Foundation, Osaka Prefectural Scholarship Foundation and bank loans, however, is not uniform between income groups. (See Table 3-2 below)
ii) Regarding the question of how the non-existence of a scholarship program under Dowa measures would impact on children's academic courses, 51.6% answered that there would have been a difference, while 48.4% answered that there would not have been a specific difference. Of those who thought that there would have been a significant difference, 19.4% answered that they would not have strongly encouraged their children to go on to the next stage of education if they were in a private school.
Looking at the same question with the data organized by parents' final educational background, among those parents who completed primary or junior high school, 48.5% answered that there would have been a difference, while 51.5% answered that there would not have been a significant difference. More than 70% of families with an annual income of less than 2 million yen answered that there would have been a difference.
2) In the case of junior colleges and colleges
i) Use of scholarships and other programs:
Among parents of college (including junior college) students, 64.7% use financial programs to support educational expenses for their children. Of these, 53.6% use the "scholarship under the Dowa measures," while the other 10.1% use other financial programs. 34.3% do not use any program.
Regarding the final educational backgrounds of those parents who use the Dowa measures scholarship program, those who achieved "primary school or junior high school graduation" account for the highest proportion at 68.6%, while those who are "college graduates" hold the lowest at 31.8%.
Referencing the data by annual family income, it is apparent that all income groups use the "scholarship program under the Dowa measures" to a similar extent. Also, those who do not use any scholarship programs and those who use the education insurance scheme provided by post offices and banks are relatively uniformly distributed across all income groups.
ii) Regarding the question as to how having no scholarship program under the Dowa measures would have impacted on children's academic courses, 61.3% answered that there would have been a difference, while 38.7% answered that there would not. Of those who thought that there would have been a difference, 27.0% answered that they would have persuaded their children to give up college regardless of whether it was public (national or prefectural) or private.
With regard to the same question, 90% of people with an annual income of less than 2 million yen answered that there would have been a difference. The response amongst this group that they would have persuaded their children to give up college (public or private) represented a higher percentage than in all other incomes groups. Also, the proportion of those with an annual income of 8 to 10 million yen who responded with "no particular difference" was higher than those who responded with "there must be a difference."
69.6% of parents answered that there would have been a difference if their children were female.
<to be continued>
Buraku Liberation News is fully responsible for summarizing the Reports in this series.
Note (1) Some of the reports are available (Japanese version only) on the website of the Osaka Prefectural Government: http://www.pref.osaka.jp/jinken/measure/tyosa/index.html
(2) Previous articles in this series can be found at http://blhrri.org/index_e.htm
Table 3-2: Use of financial program for education in Dowa districts
(Composition of parents, whose children are high school srudents, by their final educational backgrounds and annual family income)
Multiple answer
| No. of apprecable individuals | Financial support by the JSF* and OPSF** | Insurance scheme by post office and bank | Bank loan | Scholarship under the Dowa measures | Others | Not use any financial programs | Unknown | Use financial programs | ||
| Final educational background | Primary school or junior high school graduation | 188 | 9 | 11 | 5 | 130 | 3 | 39 | 3 | 146 |
| 100.0% | 4.8% | 5.9% | 2.7% | 69.1% | 1.6% | 20.7% | 1.6% | 77.7% | ||
| High school graduation | 213 | 14 | 21 | 6 | 106 | 5 | 78 | 1 | 134 | |
| 100.0% | 6.6% | 9.9% | 2.8% | 49.8% | 2.3% | 36.6% | 0.5% | 62.9% | ||
| Junior college/specialized high school graduation | 39 | 1 | 3 | 2 | 23 | 1 | 12 | - | 27 | |
| 100.0% | 2.6% | 7.7% | 5.1% | 59.0% | 2.6% | 30.8% | - | 69.2% | ||
| College graduation | 40 | 1 | 6 | - | 12 | 1 | 20 | 1 | 19 | |
| 100.0% | 2.5% | 15.0% | - | 30.0% | 2.5% | 50.0% | 2.5% | 47.5% | ||
| No school education | 1 | - | - | - | 1 | - | - | - | 1 | |
| 100.0% | - | - | - | 100.0% | - | - | - | 100.0% | ||
| Unknown | 3 | - | - | - | 1 | - | 1 | 1 | 1 | |
| 100.0% | - | - | - | 33.3% | - | 33.3% | 33.3% | 33.3% | ||
| Annual family income (yen) | Less than 1 mil | 22 | 1 | 2 | - | 12 | 1 | 7 | 2 | 13 |
| 100.0% | 4.5% | 9.1% | - | 54.5% | 4.5% | 31.8% | 9.1% | 59.1% | ||
| 1mil to 2 mil | 46 | 3 | 3 | - | 28 | - | 12 | 1 | 33 | |
| 100.0% | 6.5% | 6.5% | - | 60.9% | - | 26.1% | 2.2% | 71.7% | ||
| 2 mil to 3 mil | 55 | 5 | 1 | 1 | 36 | 2 | 12 | - | 43 | |
| 100.0% | 9.1% | 1.8% | 1.8% | 65.5% | 3.6% | 21.8% | - | 78.2% | ||
| 3 mil to 4 mil | 46 | - | 6 | - | 27 | 2 | 15 | - | 31 | |
| 100.0% | - | 13.0% | - | 58.7% | 4.3% | 32.6% | - | 67.4% | ||
| 4 mil to 5 mil | 59 | 7 | 4 | 4 | 39 | 2 | 13 | - | 46 | |
| 100.0% | 11.9% | 6.8% | 6.8% | 66.1% | 3.4% | 22.0% | - | 78.0% | ||
| 5 mil to 6 mil | 58 | 3 | 8 | 2 | 30 | 1 | 20 | - | 38 | |
| 100.0% | 5.2% | 13.8% | 3.4% | 51.7% | 1.7% | 34.5% | - | 65.5% | ||
| 6 mil to 7 mil | 34 | 1 | 4 | 2 | 19 | - | 10 | - | 24 | |
| 100.0% | 2.9% | 11.8% | 5.9% | 55.9% | - | 29.4% | - | 70.6% | ||
| 7 mil to 8 mil | 37 | 2 | 4 | 2 | 20 | 1 | 11 | - | 26 | |
| 100.0% | 5.4% | 10.8% | 5.4% | 54.1% | 2.7% | 29.7% | - | 70.3% | ||
| 8 mil to 9 mil | 35 | - | 1 | 1 | 16 | - | 17 | - | 18 | |
| 100.0% | - | 2.9% | 2.9% | 45.7% | - | 48.6% | - | 51.4% | ||
| 9 mil to 10 mil | 21 | 1 | 1 | - | 12 | - | 8 | - | 13 | |
| 100.0% | 4.8% | 4.8% | - | 57.1% | - | 38.1% | - | 61.9% | ||
| 10 mil to 15 mil | 40 | - | 4 | 1 | 20 | 1 | 15 | 1 | 24 | |
| 100.0% | - | 10.0% | 2.5% | 50.0% | 2.5% | 37.5% | 2.5% | 60.0% | ||
| 15 mil to 20 mil | 5 | - | 1 | - | 2 | - | 2 | - | 3 | |
| 100.0% | - | 20.0% | - | 40.0% | - | 40.0% | - | 60.0% | ||
| 20 mil and over | 3 | - | 1 | - | - | - | 2 | - | 1 | |
| 100.0% | - | 33.3% | - | - | - | 66.7% | - | 33.3% | ||
| Unknown | 23 | 2 | 1 | - | 12 | - | 6 | 2 | 15 | |
| 100.0% | 8.7% | 4.3% | - | 52.2% | - | 26.1% | 8.7% | 65.2% | ||
| Total | 484 | 25 | 41 | 13 | 273 | 10 | 150 | 6 | 328 | |
| 100.0% | 5.2% | 8.5% | 2.7% | 56.4% | 2.1% | 31.0% | 1.2% | 67.8% | ||
*JSF (Japan Scholarship Foundation)
**OPSF (Osaka Prefecture Scholarship Foundation
Buraku Liberation News is fully responsible for summarizing the Reports in this series.
Note (1) Some of the reports are available (Japanese version only) on the website of the Osaka Prefectural Government:
http://www.pref.osaka.jp/jinken/measure/tyosa/index.html
(2) Previous articles in this series can be found at http://blhrri.org/index_e.htm